Creatify Team
SHARE


IN THIS ARTICLE
5.3% of the people who install an iOS app are still opening it 30 days later. On Android it's 3.8%. Those are the averages Business of Apps published in July 2026, and they're the number that belongs at the top of every user acquisition dashboard.
Run the arithmetic on what that does to your costs. Business of Apps put North American cost per install between $2.50 and $5.00 in its most recent CPI research, so a $3 install works out to roughly $57 for one user who's still around in a month. iOS mid-core game installs run about $4.50 and hardcore about $6.00, which pushes the same math to $85 and $113.
Most of that waste gets decided the moment you set a bid target, weeks before onboarding ever gets a chance to matter. So this mobile app acquisition strategy guide covers the decisions that move the number: what your paid user acquisition campaigns should optimize toward, how to measure them now that the 2025 privacy roadmap got cancelled, and why creative volume ended up carrying more weight than targeting.
The install is the cheapest thing you'll buy and the least useful
An install is a download. It costs a few dollars, it shows up in your dashboard the same day, and it tells you almost nothing about whether the person will open the app twice.
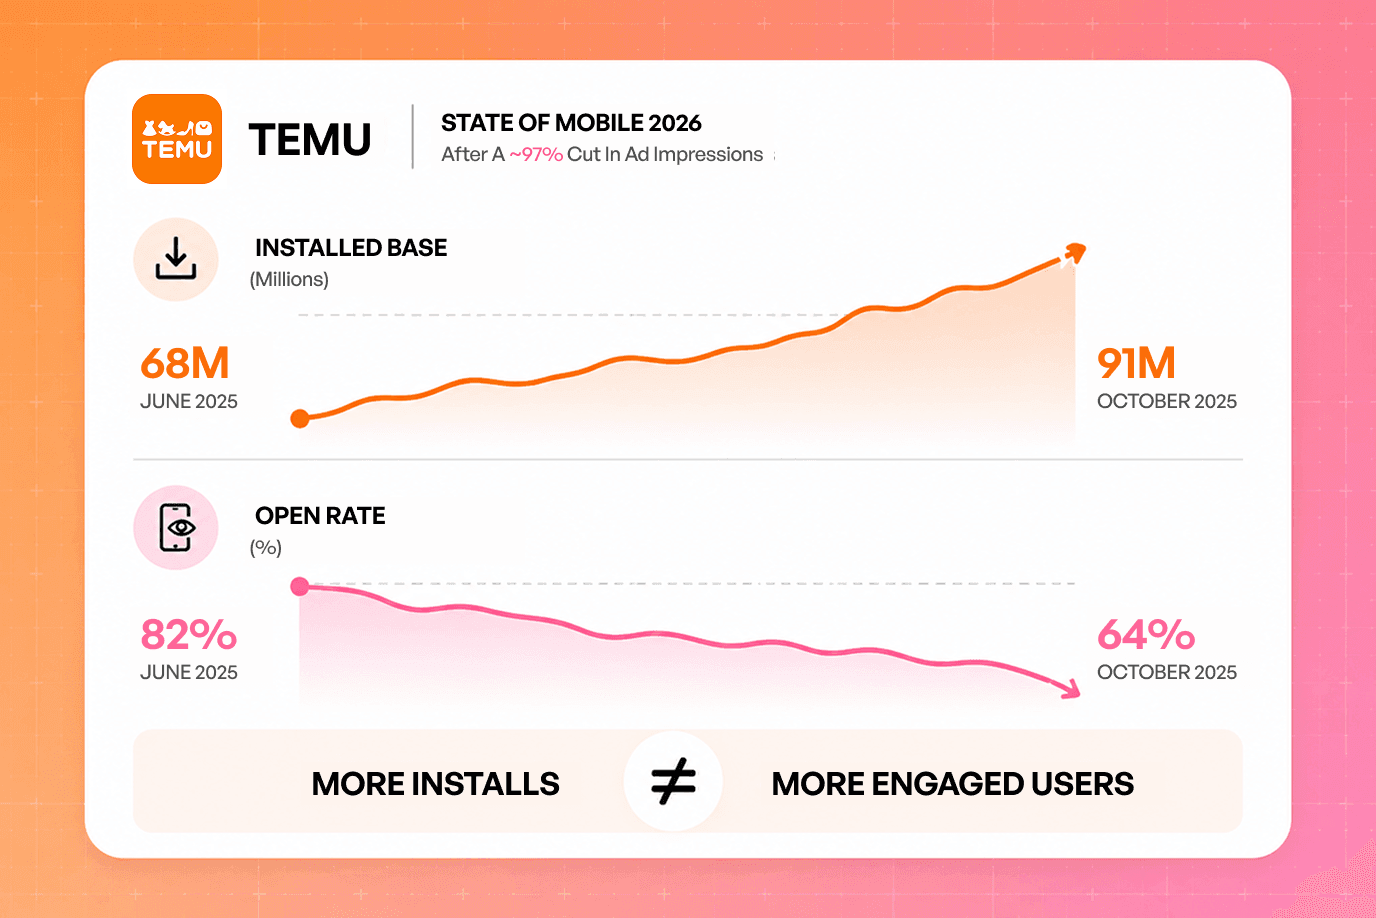
Sensor Tower's State of Mobile 2026 captured a clean illustration. After the 2025 tariff changes, Temu cut its ad impressions by roughly 97%. Its installed base kept climbing anyway, from 68 million in June to 91 million by October. Its open rate slid from 82% to 64%. Sensor Tower called it a precarious reliance on paid acquisition, and the gap between those two lines is the whole problem in one chart: installs and engaged users are different inventory.
The same report tracked casual games' day 7 retention falling steadily from early 2022 through late 2025, while ad spend concentrated in exactly those categories at a rate their in-app purchase revenue didn't justify. More money chasing users who stay for less time.
What a good mobile user acquisition strategy aims to achieve
A working mobile user acquisition strategy consistently allows to buy app users below what they're worth. Channels are downstream of that. Pick the economics first and the channel list writes itself.
Which means the metric you report to your team decides how the money gets spent. Here's the ladder, roughly in order of how much truth each rung carries:
Cost per install. Keep it as a diagnostic, drop it as a target. It measures what a download cost.
Cost per retained user. Install cost divided by day 7 or day 30 survival. Painful, honest, and easy to compute from data you already have.
Cost per activated user. Cost divided by the share who hit your activation event, whatever that is for your product.
Day 7 and day 30 ROAS. The first revenue signal that means anything.
Payback period and LTV to CAC. Where the finance conversation happens.
Two habits make the ladder work. Report by install-date cohort rather than calendar week, because blended weekly numbers hide which campaigns bought the churn. And track effective cost per install alongside raw CPI, blending in the organic installs your paid spend generated, so paid doesn't get credit for downloads the store would have delivered on its own.
Change the bid target before you change anything else in your mobile app user acquisition strategy
This is the biggest single move available in mobile app user acquisition, and it lives in a campaign setting rather than a strategy deck.
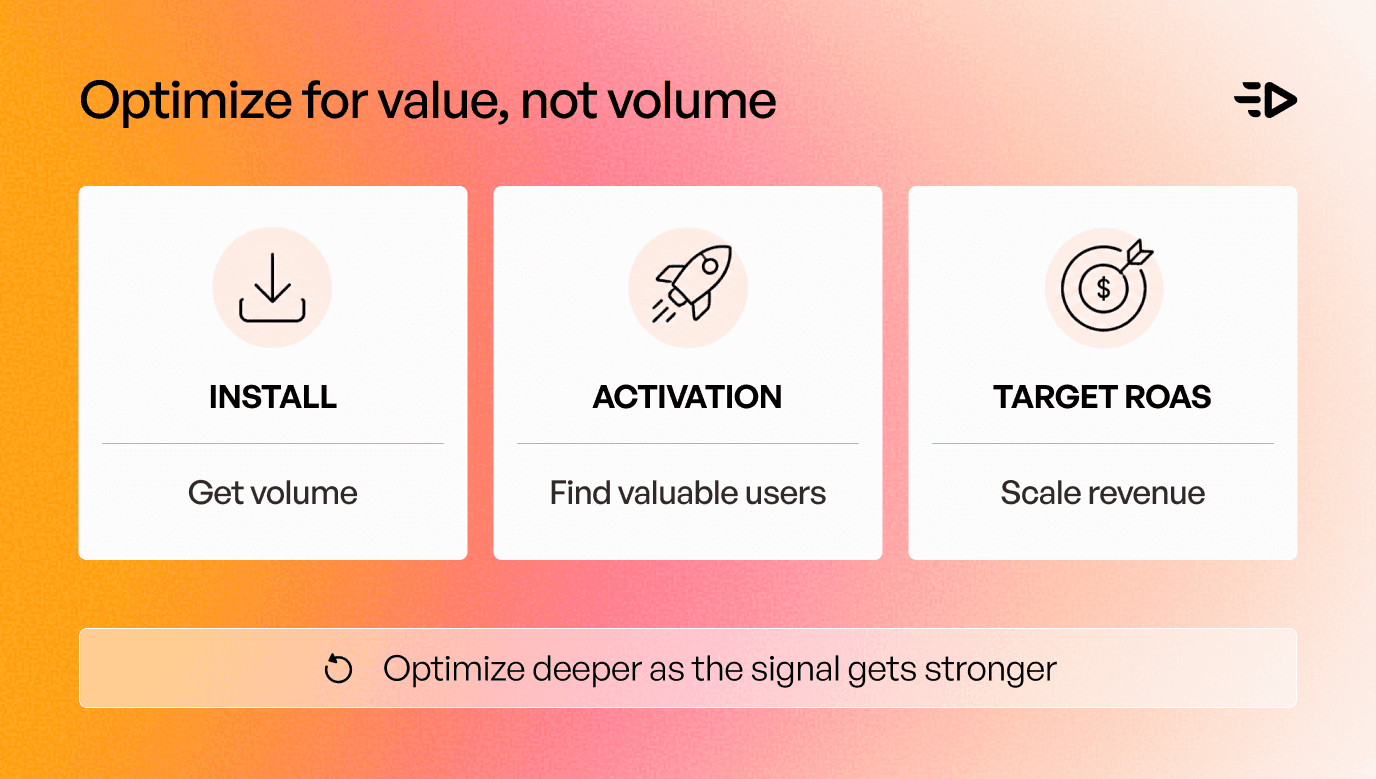
Google's own documentation for App campaign bid strategies lays out the options: target cost per install, target cost per action on an in-app event, target cost per pre-registration on Android, maximize conversions for installs or in-app actions, maximize conversion value, and target return on ad spend. Google's guidance is worth reading against your own account. Don't select multiple actions at once, because blended targets carry inconsistent values. For engagement campaigns, set the target high enough to drive 100 or more conversions before you judge anything. Expect iOS bids around 1.5 times Android.
Picking the optimization event is where teams get it wrong. It has to satisfy three conditions at once:
It predicts day 30 retention or revenue. Run the correlation before you commit.
It fires often enough to train the model. Optimizing toward "purchase" in an app where 1% purchase starves the algorithm.
It happens within hours, not weeks. A signal that arrives on day 14 can't steer a campaign.
For most apps the winner is an activation event two or three steps into the first session, not the purchase and not the install. Sequence it: install-optimized to bootstrap volume, then the activation event once it fires at sufficient density, then target ROAS once revenue data supports it.
Then close the loop. Feed post-install events back to the platform APIs and seed your value-based and lookalike audiences from users who retained, not from everyone who downloaded.
The measurement ground moved in October 2025
Most mobile user acquisition guides still describe a future that got cancelled.
On 17 October 2025, Google announced it's retiring most Privacy Sandbox technologies, and the list includes the Attribution Reporting API on Chrome and Android, Topics on both, Protected Audience on both, Protected App Signals, the SDK Runtime, and On-Device Personalization. Only CHIPS, FedCM and Private State Tokens survive, plus a new interoperable attribution standard still in development at the W3C. AdExchanger reported it the same day, alongside the UK competition regulator releasing Google from its commitments.
Three years of Android measurement planning ended in a blog post. If your measurement roadmap has a Privacy Sandbox line item, delete it.
On iOS, Apple's developer documentation confirms AdAttributionKit and SKAdNetwork run side by side. AdAttributionKit works with the App Store and with alternative app marketplaces; SKAdNetwork covers the App Store only. When both have impressions, one wins: click-through beats view-through, then the most recent timestamp, with a maximum of six impressions considered per conversion. SKAdNetwork conversion value calls get mirrored into AdAttributionKit automatically.
The practical instruction there concerns your conversion values. Encode retention and revenue milestones into them instead of install-adjacent signals, because that schema is the only thing telling iOS bidding algorithms what a good user looks like.
Whatever framework you're on, treat platform-reported performance as a claim rather than a finding. Writing for Business of Apps in May 2026, Sagi Weinberg put it plainly: most app marketers are making seven and eight figure budget decisions on numbers that report what users did, not what campaigns caused. Meta, Google and TikTok each credit themselves, and the overlaps can't be reconciled.
The answer is experiments. Weinberg lays out five designs: geo holdouts on 3 to 6 week cycles, platform lift studies through the ad platform APIs, ghost ads where the control group sees neutral creative, time-based holdouts pulsing campaigns against a forecast, and synthetic control for situations you can't randomize. The pattern he reports is consistent with what most teams find when they first run one: search and retargeting underperform their last-click numbers, while OEM, contextual and influencer channels turn out to be doing more than they got credit for.
IAB's State of Data 2026, published in February, frames attribution, incrementality and marketing mix modelling converging into one AI-assisted measurement practice. That's the direction of travel.
Creative is the lever the platforms left you
Automated buying took targeting off your desk. Google's App campaigns pick the placements, the audiences and the combinations. What you still control is what the ad says and how many versions of it exist.
That turns out to be the bigger lever anyway. NCSolutions' study of nearly 450 campaigns, updated in August 2023, attributed 49% of short-term sales lift to creative and 11% to targeting, with brand at 21%, reach at 14% and recency at 5%. That research covers CPG campaigns rather than app installs, so treat the exact split as directional. The ordering is the point.
Creative also decays on a measurable curve. Meta's own analytics team published research in May 2023 across roughly 26,000 split-test cases showing click likelihood falling as (N+1)^-0.43 with repeat exposures. By the fourth exposure, conversion likelihood drops around 45%. The average Meta impression had already been seen 4.2 times, and more than 19% had been seen more than five times on a 30-day lookback. Adding fresh creative to fatigued ad sets beat waiting the fatigue out, and the improvement scaled with how fatigued the set was.
So how much creative does that require? Eric Seufert works it backwards from the replacement rate: at 5 variants per concept and a 20% hit rate, you need 25 variants a week, which means 5 fresh concepts every week just to keep replacing the creatives you retire. Concepts are the bottleneck, since variants are mechanical and ideas are not. Seufert's five levels of marketing automation puts most teams building automated UA at level 1 of 5, with video production named as one of the two things blocking the jump to level 3.
Creative quality also decides install quality, which is the part that connects back to retention. An ad that oversells or misrepresents the product buys the cheapest installs and the fastest churn, because the person who downloads on a false premise quits in the first session. Set accurate expectations in the ad, then deep link the user from that specific ad into the matching in-app destination instead of dropping them on a cold home screen.
Creatify sits on the production side of this. Creatify Agent researches the brand and competitors, writes scripts, casts avatars, generates the shots and runs QA against the original brief, at $5 to $8 per finished ad. URL to Video takes an App Store or Google Play link and returns 5 to 10 script variations in under 60 seconds, which covers the variant half of Seufert's math. Performance Agent connects to Meta, Google, TikTok and AppLovin, audits the accounts, and launches from the same chat where the creative got made.
LAIFE is a useful example of what volume does. The Harvard-founded longevity brand needed 50 or more videos a week to feed TikTok's GMV MAX algorithm and was stuck producing 10, with earlier AI tools returning avatars whose lip sync killed credibility. After moving to Creatify they produce 50 creatives a week and hit $3.89 cost per order. The rental app Zumper went from 0 to more than 300 videos in a quarter and saved $20,000 a month. Algorithms need candidates before they can find winners.
Where paid user acquisition budget leaks
Seven failure modes account for most wasted paid user acquisition spend. Six of them are fixable this quarter.
Optimizing to installs. Covered above. Change the bid target.
Invalid traffic. Lunio's Global Invalid Traffic Report 2026, covered by the ANA in January, put $63 billion of ad spend lost to invalid traffic at an average 8.5% rate across channels, with AI agents and bots driving the increase. That figure spans digital advertising generally, so treat it as an order of magnitude for the app slice, not a benchmark.
Trusting platform-reported ROAS. Run one holdout before you believe any of it.
Judging cohorts too early, or too late. Both are expensive. Use predicted lifetime value from day 0 and day 1 behaviour to make the kill decision, then confirm against the mature cohort.
Creative starvation. One hero video running six weeks against Meta's fatigue curve.
No organic uplift accounting. Paid takes credit for downloads the store was going to deliver.
Scaling before the store listing converts. Every channel funnels back to the product page.
The half of a mobile app acquisition strategy that isn't media buying
Source: Good Faces Agency
Paid spend only pays back if the product converts an install into a habit, which makes onboarding part of the acquisition system rather than someone else's problem.
Read the retention curve as three different questions. Day 1 tells you whether the first session delivered value. Day 7 tells you whether a habit formed. Day 30 tells you whether the product fits. A campaign with healthy day 1 and collapsed day 7 is a product signal, not a media signal, and no bid adjustment will fix it.
Push notifications, in-app messaging and re-engagement campaigns are all cheaper than buying a replacement user, so they belong in the same budget conversation. Marketing and product should co-own day 1 retention, because the ad sets the expectation and the first session either meets it or doesn't.
App store optimization compounds with all of it. Writing for Business of Apps in August 2026, Gummicube's Stephanie Ino described the reinforcement: running Apple Search Ads on targeted keywords signals relevance to Apple's ranking algorithm, Play Store placements do something similar on Google, and every channel routes back to the same product page. Optimize the listing before you scale spend into it.
A 30/60/90 build for a user acquisition strategy for apps
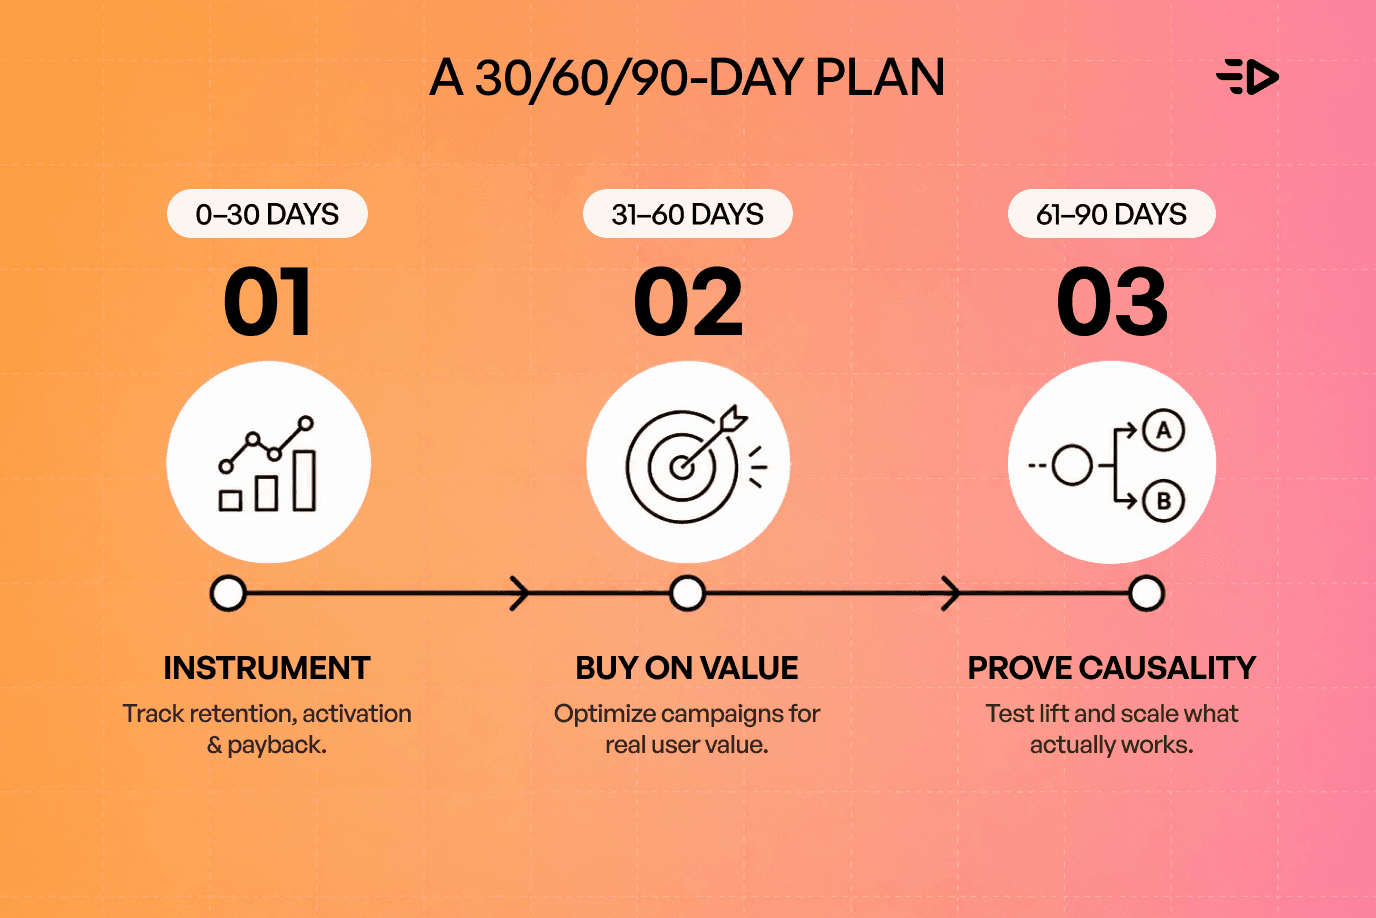
Days 0 to 30, instrument. Define an event schema tied to retention. Pick your activation event and validate that it correlates with day 30. Get cohort reporting by install date. Baseline day 1, day 7 and day 30 retention plus payback period per channel.
Days 31 to 60, buy on value. Move campaigns off install targets onto the activation event. Set target ROAS where revenue density supports it. Rewrite your SKAdNetwork conversion values around retention milestones. Stand up a creative pipeline with a weekly concept quota. Fix the store listing.
Days 61 to 90, prove causality. Run your first geo holdout or platform lift test. Reconcile the result against platform-reported numbers and reallocate on what you find. Formalize the creative loop as concepts, then themes, then variants.
Choosing a mobile user acquisition platform
A working mobile user acquisition stack needs four jobs covered, and no single mobile user acquisition platform does all four well.
Attribution and cohort analytics tell you what happened. An incrementality practice tells you what you caused, whether that's platform lift APIs or your own geo tests. Campaign automation runs the buying. Creative production feeds the automation, and it's the piece most teams under-resource, because it's the only input the platforms didn't take over.
When you evaluate any user acquisition solution, ask what it does about install quality specifically. Anything that only reports volume and cost is measuring the easy half.
Wrapping up
The moves that matter in a mobile app user acquisition strategy are unglamorous. Change the bid target to an event that predicts retention. Rewrite your conversion value schema. Delete Privacy Sandbox from the roadmap and replace it with a holdout test. Produce enough creative that the algorithm has something to choose between.
One thing worth sitting with: every one of those changes makes your reported numbers look worse before they make your business better. Cost per activated user is a bigger number than CPI. Incrementality-adjusted ROAS is lower than platform-reported ROAS. Teams that scale profitably are usually the ones that got comfortable reporting the uglier, truer number to their own leadership first.
Read also: Ad analytics tools compared: dashboards, optimizers, and agents that close the loop
Frequently Asked Questions
What is a mobile user acquisition strategy?
A mobile user acquisition strategy is the system an app uses to buy new users below what those users are worth, across paid and organic channels. A good one specifies the optimization event, the measurement method, the creative cadence and the payback target, rather than listing channels.
How much does paid user acquisition cost for an app?
Business of Apps' CPI research puts global cost per install at roughly $1.50 to $3.50 on iOS and $1.50 to $4.00 on Android, with North America at $2.50 to $5.00 and Latin America as low as $0.50. That data was last refreshed in early 2025, so treat it as a floor rather than a current quote. Genre matters more than platform: iOS hardcore game installs average about $6.00 against $3.00 for puzzle.
What's the difference between CPI and true user acquisition cost?
CPI counts every download. True acquisition cost divides your spend by the users who survived and monetized, which at average day 30 retention means dividing by roughly 1 in 20 on iOS. Effective CPI sits between the two, blending in organic installs your paid campaigns generated.
Should paid user acquisition campaigns optimize for installs or in-app events?
In-app events, once the event fires often enough to train the bidding model. Google supports target cost per action and target ROAS on App campaigns for exactly this, and recommends against selecting multiple actions at once because the blended target carries inconsistent values.
How do I know if my user acquisition campaigns are incremental?
Run an experiment rather than reading a report. Geo holdouts on a 3 to 6 week cycle, platform lift studies, ghost ads and time-based holdouts all answer whether installs would have happened without the spend. Search and retargeting commonly look worse under incrementality than under last-click.
How many creatives does a mobile app acquisition strategy need?
Work backwards from your replacement rate. At a 20% hit rate and 5 variants per concept, Eric Seufert's math puts it at 25 variants a week, or 5 fresh concepts. Meta's research showing conversion likelihood dropping around 45% by the fourth exposure is the reason the treadmill doesn't stop.
What should I look for in a mobile user acquisition platform?
Coverage of four jobs: attribution and cohort analytics, incrementality testing, campaign automation, and creative production at volume. Judge each candidate on whether it reports install quality, not only install cost.
5.3% of the people who install an iOS app are still opening it 30 days later. On Android it's 3.8%. Those are the averages Business of Apps published in July 2026, and they're the number that belongs at the top of every user acquisition dashboard.
Run the arithmetic on what that does to your costs. Business of Apps put North American cost per install between $2.50 and $5.00 in its most recent CPI research, so a $3 install works out to roughly $57 for one user who's still around in a month. iOS mid-core game installs run about $4.50 and hardcore about $6.00, which pushes the same math to $85 and $113.
Most of that waste gets decided the moment you set a bid target, weeks before onboarding ever gets a chance to matter. So this mobile app acquisition strategy guide covers the decisions that move the number: what your paid user acquisition campaigns should optimize toward, how to measure them now that the 2025 privacy roadmap got cancelled, and why creative volume ended up carrying more weight than targeting.
The install is the cheapest thing you'll buy and the least useful
An install is a download. It costs a few dollars, it shows up in your dashboard the same day, and it tells you almost nothing about whether the person will open the app twice.
Sensor Tower's State of Mobile 2026 captured a clean illustration. After the 2025 tariff changes, Temu cut its ad impressions by roughly 97%. Its installed base kept climbing anyway, from 68 million in June to 91 million by October. Its open rate slid from 82% to 64%. Sensor Tower called it a precarious reliance on paid acquisition, and the gap between those two lines is the whole problem in one chart: installs and engaged users are different inventory.
The same report tracked casual games' day 7 retention falling steadily from early 2022 through late 2025, while ad spend concentrated in exactly those categories at a rate their in-app purchase revenue didn't justify. More money chasing users who stay for less time.
What a good mobile user acquisition strategy aims to achieve
A working mobile user acquisition strategy consistently allows to buy app users below what they're worth. Channels are downstream of that. Pick the economics first and the channel list writes itself.
Which means the metric you report to your team decides how the money gets spent. Here's the ladder, roughly in order of how much truth each rung carries:
Cost per install. Keep it as a diagnostic, drop it as a target. It measures what a download cost.
Cost per retained user. Install cost divided by day 7 or day 30 survival. Painful, honest, and easy to compute from data you already have.
Cost per activated user. Cost divided by the share who hit your activation event, whatever that is for your product.
Day 7 and day 30 ROAS. The first revenue signal that means anything.
Payback period and LTV to CAC. Where the finance conversation happens.
Two habits make the ladder work. Report by install-date cohort rather than calendar week, because blended weekly numbers hide which campaigns bought the churn. And track effective cost per install alongside raw CPI, blending in the organic installs your paid spend generated, so paid doesn't get credit for downloads the store would have delivered on its own.
Change the bid target before you change anything else in your mobile app user acquisition strategy
This is the biggest single move available in mobile app user acquisition, and it lives in a campaign setting rather than a strategy deck.
Google's own documentation for App campaign bid strategies lays out the options: target cost per install, target cost per action on an in-app event, target cost per pre-registration on Android, maximize conversions for installs or in-app actions, maximize conversion value, and target return on ad spend. Google's guidance is worth reading against your own account. Don't select multiple actions at once, because blended targets carry inconsistent values. For engagement campaigns, set the target high enough to drive 100 or more conversions before you judge anything. Expect iOS bids around 1.5 times Android.
Picking the optimization event is where teams get it wrong. It has to satisfy three conditions at once:
It predicts day 30 retention or revenue. Run the correlation before you commit.
It fires often enough to train the model. Optimizing toward "purchase" in an app where 1% purchase starves the algorithm.
It happens within hours, not weeks. A signal that arrives on day 14 can't steer a campaign.
For most apps the winner is an activation event two or three steps into the first session, not the purchase and not the install. Sequence it: install-optimized to bootstrap volume, then the activation event once it fires at sufficient density, then target ROAS once revenue data supports it.
Then close the loop. Feed post-install events back to the platform APIs and seed your value-based and lookalike audiences from users who retained, not from everyone who downloaded.
The measurement ground moved in October 2025
Most mobile user acquisition guides still describe a future that got cancelled.
On 17 October 2025, Google announced it's retiring most Privacy Sandbox technologies, and the list includes the Attribution Reporting API on Chrome and Android, Topics on both, Protected Audience on both, Protected App Signals, the SDK Runtime, and On-Device Personalization. Only CHIPS, FedCM and Private State Tokens survive, plus a new interoperable attribution standard still in development at the W3C. AdExchanger reported it the same day, alongside the UK competition regulator releasing Google from its commitments.
Three years of Android measurement planning ended in a blog post. If your measurement roadmap has a Privacy Sandbox line item, delete it.
On iOS, Apple's developer documentation confirms AdAttributionKit and SKAdNetwork run side by side. AdAttributionKit works with the App Store and with alternative app marketplaces; SKAdNetwork covers the App Store only. When both have impressions, one wins: click-through beats view-through, then the most recent timestamp, with a maximum of six impressions considered per conversion. SKAdNetwork conversion value calls get mirrored into AdAttributionKit automatically.
The practical instruction there concerns your conversion values. Encode retention and revenue milestones into them instead of install-adjacent signals, because that schema is the only thing telling iOS bidding algorithms what a good user looks like.
Whatever framework you're on, treat platform-reported performance as a claim rather than a finding. Writing for Business of Apps in May 2026, Sagi Weinberg put it plainly: most app marketers are making seven and eight figure budget decisions on numbers that report what users did, not what campaigns caused. Meta, Google and TikTok each credit themselves, and the overlaps can't be reconciled.
The answer is experiments. Weinberg lays out five designs: geo holdouts on 3 to 6 week cycles, platform lift studies through the ad platform APIs, ghost ads where the control group sees neutral creative, time-based holdouts pulsing campaigns against a forecast, and synthetic control for situations you can't randomize. The pattern he reports is consistent with what most teams find when they first run one: search and retargeting underperform their last-click numbers, while OEM, contextual and influencer channels turn out to be doing more than they got credit for.
IAB's State of Data 2026, published in February, frames attribution, incrementality and marketing mix modelling converging into one AI-assisted measurement practice. That's the direction of travel.
Creative is the lever the platforms left you
Automated buying took targeting off your desk. Google's App campaigns pick the placements, the audiences and the combinations. What you still control is what the ad says and how many versions of it exist.
That turns out to be the bigger lever anyway. NCSolutions' study of nearly 450 campaigns, updated in August 2023, attributed 49% of short-term sales lift to creative and 11% to targeting, with brand at 21%, reach at 14% and recency at 5%. That research covers CPG campaigns rather than app installs, so treat the exact split as directional. The ordering is the point.
Creative also decays on a measurable curve. Meta's own analytics team published research in May 2023 across roughly 26,000 split-test cases showing click likelihood falling as (N+1)^-0.43 with repeat exposures. By the fourth exposure, conversion likelihood drops around 45%. The average Meta impression had already been seen 4.2 times, and more than 19% had been seen more than five times on a 30-day lookback. Adding fresh creative to fatigued ad sets beat waiting the fatigue out, and the improvement scaled with how fatigued the set was.
So how much creative does that require? Eric Seufert works it backwards from the replacement rate: at 5 variants per concept and a 20% hit rate, you need 25 variants a week, which means 5 fresh concepts every week just to keep replacing the creatives you retire. Concepts are the bottleneck, since variants are mechanical and ideas are not. Seufert's five levels of marketing automation puts most teams building automated UA at level 1 of 5, with video production named as one of the two things blocking the jump to level 3.
Creative quality also decides install quality, which is the part that connects back to retention. An ad that oversells or misrepresents the product buys the cheapest installs and the fastest churn, because the person who downloads on a false premise quits in the first session. Set accurate expectations in the ad, then deep link the user from that specific ad into the matching in-app destination instead of dropping them on a cold home screen.
Creatify sits on the production side of this. Creatify Agent researches the brand and competitors, writes scripts, casts avatars, generates the shots and runs QA against the original brief, at $5 to $8 per finished ad. URL to Video takes an App Store or Google Play link and returns 5 to 10 script variations in under 60 seconds, which covers the variant half of Seufert's math. Performance Agent connects to Meta, Google, TikTok and AppLovin, audits the accounts, and launches from the same chat where the creative got made.
LAIFE is a useful example of what volume does. The Harvard-founded longevity brand needed 50 or more videos a week to feed TikTok's GMV MAX algorithm and was stuck producing 10, with earlier AI tools returning avatars whose lip sync killed credibility. After moving to Creatify they produce 50 creatives a week and hit $3.89 cost per order. The rental app Zumper went from 0 to more than 300 videos in a quarter and saved $20,000 a month. Algorithms need candidates before they can find winners.
Where paid user acquisition budget leaks
Seven failure modes account for most wasted paid user acquisition spend. Six of them are fixable this quarter.
Optimizing to installs. Covered above. Change the bid target.
Invalid traffic. Lunio's Global Invalid Traffic Report 2026, covered by the ANA in January, put $63 billion of ad spend lost to invalid traffic at an average 8.5% rate across channels, with AI agents and bots driving the increase. That figure spans digital advertising generally, so treat it as an order of magnitude for the app slice, not a benchmark.
Trusting platform-reported ROAS. Run one holdout before you believe any of it.
Judging cohorts too early, or too late. Both are expensive. Use predicted lifetime value from day 0 and day 1 behaviour to make the kill decision, then confirm against the mature cohort.
Creative starvation. One hero video running six weeks against Meta's fatigue curve.
No organic uplift accounting. Paid takes credit for downloads the store was going to deliver.
Scaling before the store listing converts. Every channel funnels back to the product page.
The half of a mobile app acquisition strategy that isn't media buying
Source: Good Faces Agency
Paid spend only pays back if the product converts an install into a habit, which makes onboarding part of the acquisition system rather than someone else's problem.
Read the retention curve as three different questions. Day 1 tells you whether the first session delivered value. Day 7 tells you whether a habit formed. Day 30 tells you whether the product fits. A campaign with healthy day 1 and collapsed day 7 is a product signal, not a media signal, and no bid adjustment will fix it.
Push notifications, in-app messaging and re-engagement campaigns are all cheaper than buying a replacement user, so they belong in the same budget conversation. Marketing and product should co-own day 1 retention, because the ad sets the expectation and the first session either meets it or doesn't.
App store optimization compounds with all of it. Writing for Business of Apps in August 2026, Gummicube's Stephanie Ino described the reinforcement: running Apple Search Ads on targeted keywords signals relevance to Apple's ranking algorithm, Play Store placements do something similar on Google, and every channel routes back to the same product page. Optimize the listing before you scale spend into it.
A 30/60/90 build for a user acquisition strategy for apps
Days 0 to 30, instrument. Define an event schema tied to retention. Pick your activation event and validate that it correlates with day 30. Get cohort reporting by install date. Baseline day 1, day 7 and day 30 retention plus payback period per channel.
Days 31 to 60, buy on value. Move campaigns off install targets onto the activation event. Set target ROAS where revenue density supports it. Rewrite your SKAdNetwork conversion values around retention milestones. Stand up a creative pipeline with a weekly concept quota. Fix the store listing.
Days 61 to 90, prove causality. Run your first geo holdout or platform lift test. Reconcile the result against platform-reported numbers and reallocate on what you find. Formalize the creative loop as concepts, then themes, then variants.
Choosing a mobile user acquisition platform
A working mobile user acquisition stack needs four jobs covered, and no single mobile user acquisition platform does all four well.
Attribution and cohort analytics tell you what happened. An incrementality practice tells you what you caused, whether that's platform lift APIs or your own geo tests. Campaign automation runs the buying. Creative production feeds the automation, and it's the piece most teams under-resource, because it's the only input the platforms didn't take over.
When you evaluate any user acquisition solution, ask what it does about install quality specifically. Anything that only reports volume and cost is measuring the easy half.
Wrapping up
The moves that matter in a mobile app user acquisition strategy are unglamorous. Change the bid target to an event that predicts retention. Rewrite your conversion value schema. Delete Privacy Sandbox from the roadmap and replace it with a holdout test. Produce enough creative that the algorithm has something to choose between.
One thing worth sitting with: every one of those changes makes your reported numbers look worse before they make your business better. Cost per activated user is a bigger number than CPI. Incrementality-adjusted ROAS is lower than platform-reported ROAS. Teams that scale profitably are usually the ones that got comfortable reporting the uglier, truer number to their own leadership first.
Read also: Ad analytics tools compared: dashboards, optimizers, and agents that close the loop
Frequently Asked Questions
What is a mobile user acquisition strategy?
A mobile user acquisition strategy is the system an app uses to buy new users below what those users are worth, across paid and organic channels. A good one specifies the optimization event, the measurement method, the creative cadence and the payback target, rather than listing channels.
How much does paid user acquisition cost for an app?
Business of Apps' CPI research puts global cost per install at roughly $1.50 to $3.50 on iOS and $1.50 to $4.00 on Android, with North America at $2.50 to $5.00 and Latin America as low as $0.50. That data was last refreshed in early 2025, so treat it as a floor rather than a current quote. Genre matters more than platform: iOS hardcore game installs average about $6.00 against $3.00 for puzzle.
What's the difference between CPI and true user acquisition cost?
CPI counts every download. True acquisition cost divides your spend by the users who survived and monetized, which at average day 30 retention means dividing by roughly 1 in 20 on iOS. Effective CPI sits between the two, blending in organic installs your paid campaigns generated.
Should paid user acquisition campaigns optimize for installs or in-app events?
In-app events, once the event fires often enough to train the bidding model. Google supports target cost per action and target ROAS on App campaigns for exactly this, and recommends against selecting multiple actions at once because the blended target carries inconsistent values.
How do I know if my user acquisition campaigns are incremental?
Run an experiment rather than reading a report. Geo holdouts on a 3 to 6 week cycle, platform lift studies, ghost ads and time-based holdouts all answer whether installs would have happened without the spend. Search and retargeting commonly look worse under incrementality than under last-click.
How many creatives does a mobile app acquisition strategy need?
Work backwards from your replacement rate. At a 20% hit rate and 5 variants per concept, Eric Seufert's math puts it at 25 variants a week, or 5 fresh concepts. Meta's research showing conversion likelihood dropping around 45% by the fourth exposure is the reason the treadmill doesn't stop.
What should I look for in a mobile user acquisition platform?
Coverage of four jobs: attribution and cohort analytics, incrementality testing, campaign automation, and creative production at volume. Judge each candidate on whether it reports install quality, not only install cost.